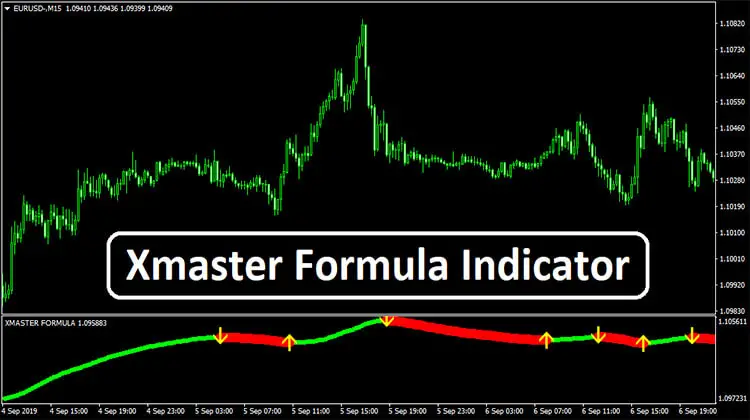
Xmaster Formula Indicator can be described best as one of the most straightforward trend-following trading tools in the market.
It signals possible changes in the trend directions and also demonstrates the strength of the current market trend at the same time.
Its simplicity of use and easy way of demonstrating the trend signals offer great opportunities for newbie traders.
Xmaster Formula Indicator Overview
Xmaster Formula Indicator is an intraday trading indicator. Thus, fits excellent with time frames like M30, H1, and H4 within the MT4 trading terminal.
However, this indicator can be applied to trade all kinds of forex currency pairs within the financial markets.
After the installation of the Indicator at the MT4 platform, you’ll find your chart like the image below:

Xmaster Formula Indicator Explanation
The Indicator uses a separate oscillator window in order to demonstrate the trend signals.
The indicator curve turns yellow when the trend is bullish and turns red in case of a bearish market trend.
The up/downward arrows are plotted as confirmation signals for the market entries.

The curve moving upwards means the bullish strength of the market trend and a down-moving curve represents the strength of the current bearish trend of the market.
Also Read: Best Forex Trading Strategy Ever
Xmaster Indicator: Buy Rules

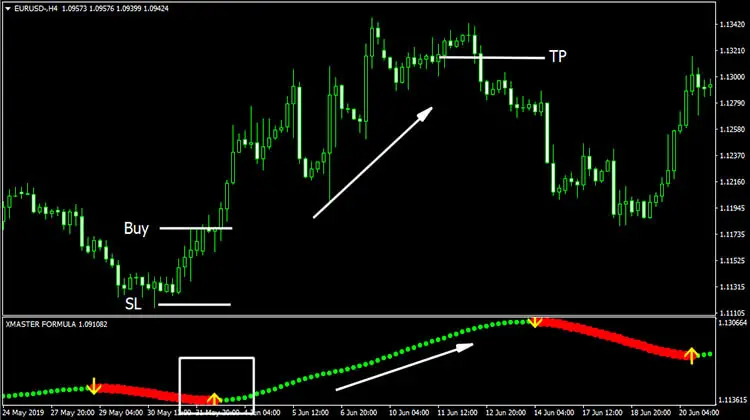
- The Indicator turns yellow and plots an arrow pointing upwards at the same time
- The price bar closes as a solid bullish candle
- Buy triggers when both above conditions are met
- Set stop loss below the low of the signaling bar
- Exit long/take profit whenever the indicator turns red and plots arrow pointing downwards
Xmaster Indicator: Sell Rules

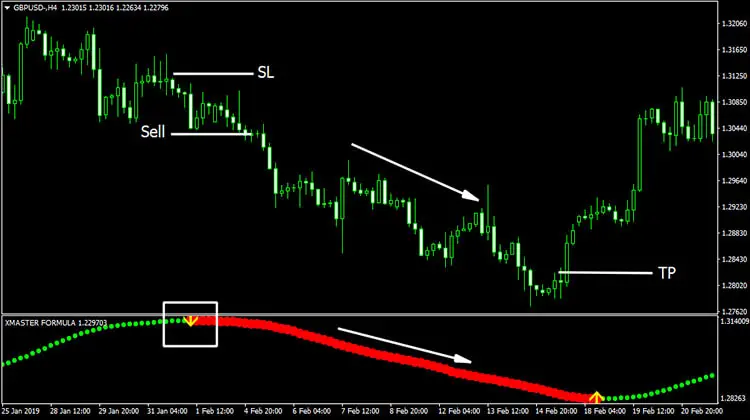
- The Indicator turns red and plots an arrow pointing downwards at the same time
- The price bar closes as a solid bearish candle
- Sell triggers when both above conditions are met
- Set stop loss above the high of the signaling bar
- Exit short/take profit whenever the indicator turns yellow and plots arrow pointing upwards