TrendStrength OMA Signals Indicator is not only known as a trend signal indicator but also famous as a trend meter. It detects the trend, signals the trade entry, and also signals the exit at the possible end of the respective trend.
Most importantly, newbie traders find it especially useful for its complete trading guidelines from start to end of each trade.
TrendStrength OMA Signals Indicator can be applied to trade all kinds of forex currency pairs and also fits great with all sorts of timeframe charts. Hence, you’ll face no problem in choosing your favorite forex currency pairs and timeframes that match your trading style.
TrendStrength OMA Signals Indicator Overview:
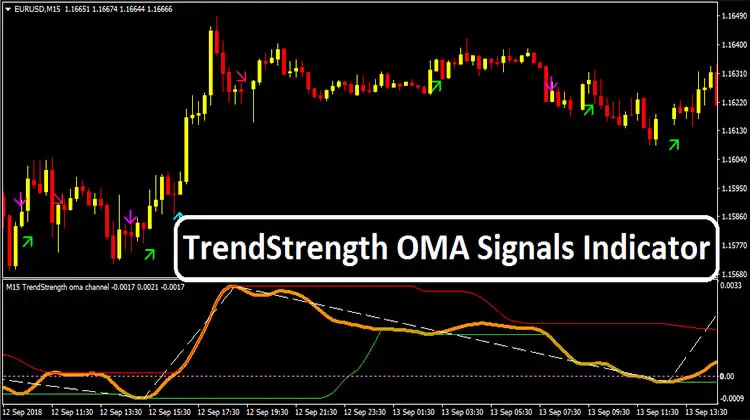
After installing TrendStrength OMA Signals Indicator at your forex MT4 platform, your trading chart will appear like the following image:

TrendStrength OMA Signals Indicator applies OMA trend detectors to define the market trends. Its parameter turns negative means the oversold condition and positive value signals the overbought condition of the market respectively. An upward arrow appears at the oversold condition of the market signals the buy entry.
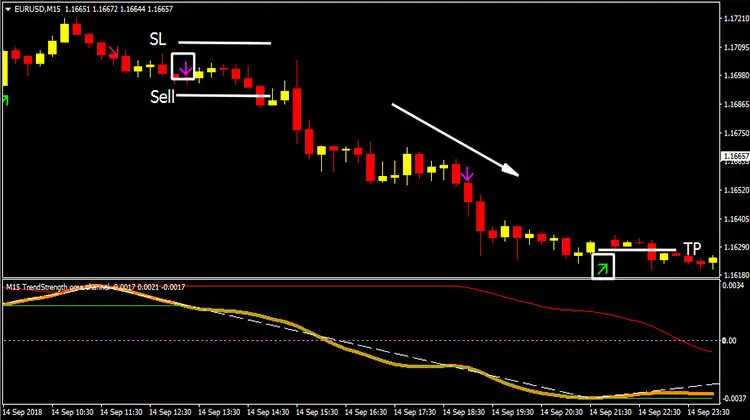
Conversely, A downward arrow at the overbought condition of the market is interpreted as the sell signal. An arrow that appears in the opposite direction of your market entry is considered as the trade exit signal.
More About: TOP FOREX STRATEGY EVER
TrendStrength OMA Signals Indicator: Buy Parameters

- Trend Strength OMA Signals Indicator value is negative signaling the oversold condition
- An upward arrow appears right below a newly formed bullish bar at the bottom of the chart
- Buy triggers at the break of the respective bullish bar’s high
- Set stop loss below the signaling bar’s low
- Exit long/take profit whenever a downward arrow is plotted
TrendStrength OMA Signals Indicator: Sell Parameters

- Trend Strength OMA Signals Indicator value is positive signaling the overbought condition
- A downward arrow appears right above a newly formed bearish bar at the top of the chart
- Sell triggers at the break of the respective bearish bar’s low
- Set stop loss above the signaling bar’s high
- Exit short/take profit whenever an upward arrow is plotted
I find this rather interesting. Is it possible to find out a bit about the lines window? The arrow stuff makes sense however I would like to know a bit about what the lines are plotting….ie red, green, white dotted and orange.