In terms of price action trading, a pin bar means a “rejection”. A pin bar forms when price rejects to go any further of a particular market level and intends to move towards the opposite direction of its current momentum. Pin bar can be used for both reversal and trend-based trading purposes. Moreover, it signals the possible direction of the price movement in a very clear and understandable manner. That is the reason why pin bar trading strategy has been one of the most widely accepted price action trading technique among the traders around the world.
Pin Bar Anatomy
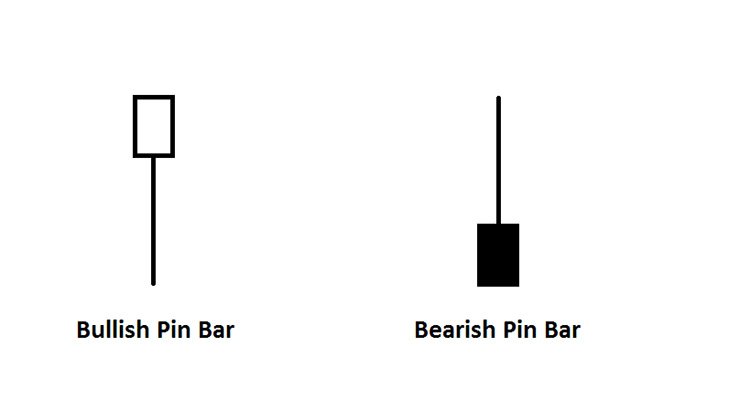
A pin bar forms with a long upper or lower tail and a small body. The space between open and close of the pin bar is known as the “body”. A bullish pin bar forms when price closes higher of its open with a long tail below the body. This means price was initially dropped by the sellers but at a certain point, buyers pushed back and manage to close it above its open price. Literally, this is a winning situation for the buyers which may logically cause an immediate price hike. Oppositely, after a bearish pin bar forms, price intends to fall further most of the time. Traders use such scenarios as an advantage to predict the next possible direction of the market.
Trading with the trend using Pin Bars
Pin bar signals can be used to anticipate the continuation of any particular trend. The rules of trading the trend using pin bars may look very straightforward but simple:
- Buy: A bullish pin bar forms in a bullish trend of the market
- Sell: A bearish pin bar forms in a bearish trend of the market
Thus, your job is to access the market trend first. Then look for a suitable pin bar signal that matches with the direction of the predetermined market trend.
Let’s have a look at an example:
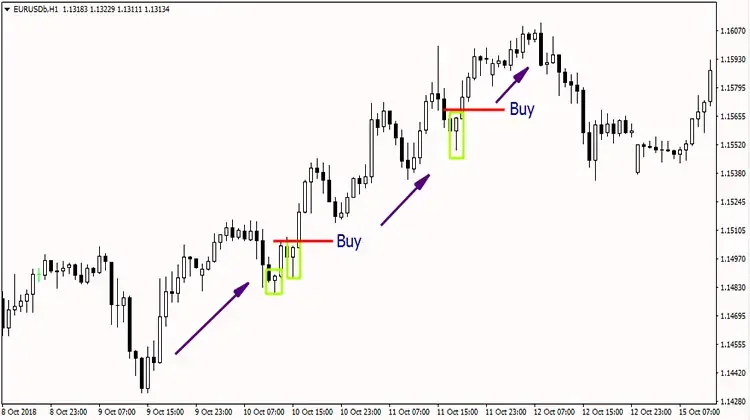
This is an EURUSD hourly chart. At the initial stage, the price was deliberately making new highs confirming the bullish trend of the market. You can see, every time a bullish pin bar appears, price resumes the uptrend and continues hiking upwards. In this chart, each of the bullish pin bars represents buy signals along with the bullish trend.
It is very important to be able to identify the trend correctly. Because trading against the trend is one big reason why traders end up losing money. Beside the high-low method, you can also try other trend identifying tools like trendlines, moving averages or trend based oscillators for consistent results.
Now, we’ll show you how a simple trend line along with the pin bars can produce profitable trade signals.
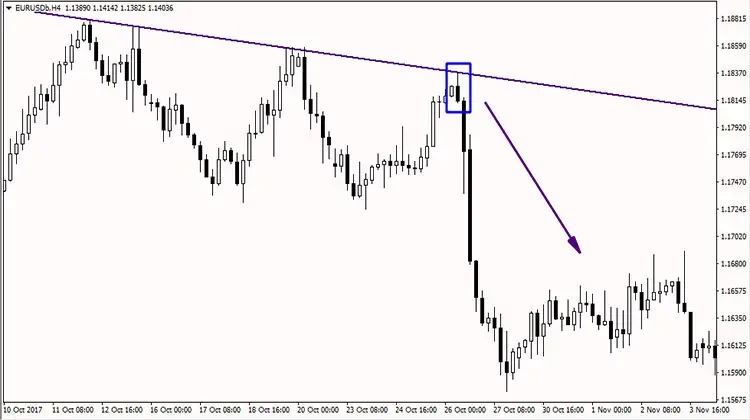
This is a 4-hourly EURUSD chart. Initially, we’ve connected two lower highs to project a bearish trendline. Everytime price went closer to the trendline level was pushed back to the downwards by the sellers. This proves the trendline is valid and the market is in the bearish trend. After a couple of attempts to break the trendline, a bearish pin bar formed right at the trendline level indicating a clear rejection from the respective area. A bearish pin bar along with the bearish trend means the market has an intention to go further down following the trend direction.
Swing trading using Pin Bars
Swing traders simply aim to buy from the low and sell from the high of the market momentum. They need to act very quickly to capture the momentum lengths and convert them into profitable trades. Well, that may sound exciting but in reality, swing trading is risky as much as it is profitable. Pin bar is one powerful indicator used by the traders to meet such challenges of dynamic and volatile markets.
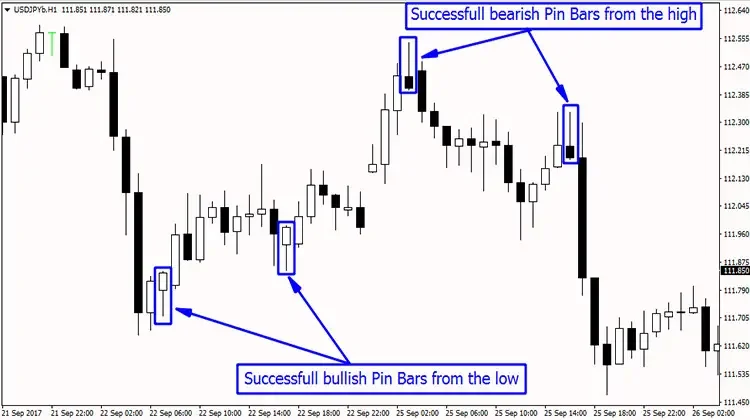
This hourly USDJPY chart shows how bullish pin bars from the low and bearish pin bars from the high can play significant roles in producing successful swing trading signals.
But remember, a pin bar at the reversal moment doesn’t work all the time. Sometimes also we encounter failed pin bars. Now. let’s look at the same USDJPY chart of the previous example:
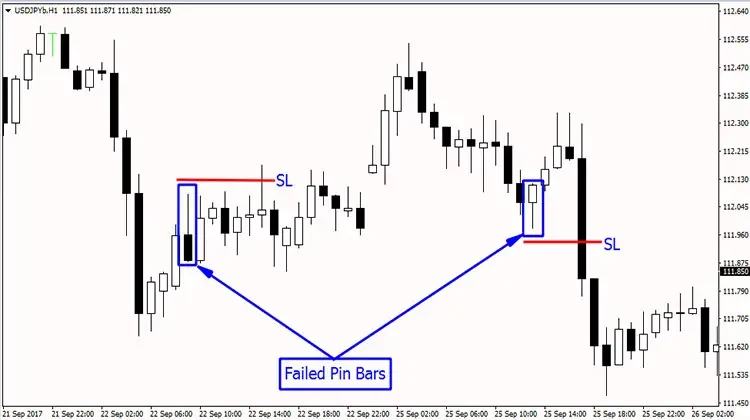
When that first bearish pin bar appeared (marked as failed pin bar), you might go for short thinking that price is going to dive to the downwards again in relation to its recent bearish move. Secondly, the bullish pin bar (as marked) may also insist you entering long thinking that price might continue to go up to create new highs as it is still producing higher lows. But as you can see, both of the pin bars ended up as a losing trade. It may look a bit frustrating but there are ways to avoid such bad pin bars. The only thing you need to do is, add some other technical factors like indicators, tools or oscillators to justify the signals and filter out the good pin bars from the bad one.
Read It: Best Forex Strategy System
Let’s see an example of how a simple support or resistance level can help you to avoid bad pin bars:
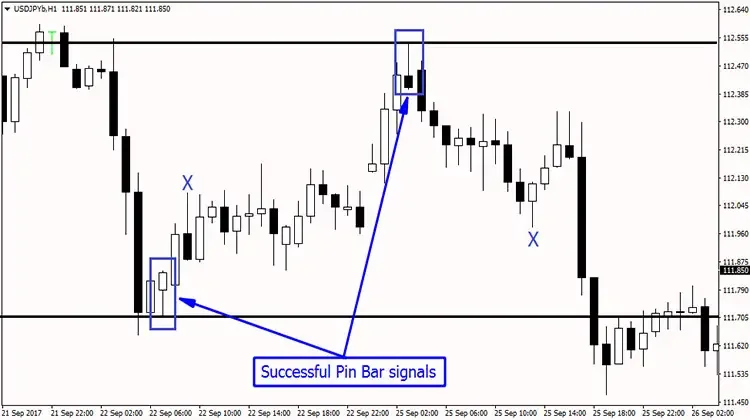
We’ve used the same chart again to show how those two previously marked bad pin bars can be avoided using horizontal support and resistance levels. Here, we’ve only accepted the pin bar signals which are originated from the predetermined S/R levels and ignored the signals appeared at the middle (marked as “X”). The rules to be accomplished with such trading strategies are as simple as follows:
- Buy: When a bullish pin bar appears right at the support level
- Sell: When a bearish pin bar appears right at the resistance level
- Never enter a trade at the middle of a support and resistance level
The Bottom Line
As you can see from the above examples, using pin bar signals in Forex trading is profitable but like other strategies, you’ll need to be able to filter out the bad signals and wait for the right setup with patience and discipline. The best thing about pin bar is, you can add it to almost all kinds of forex trading strategies and once you be able to do that correctly, your trading result just gets better than ever! Happy trading.