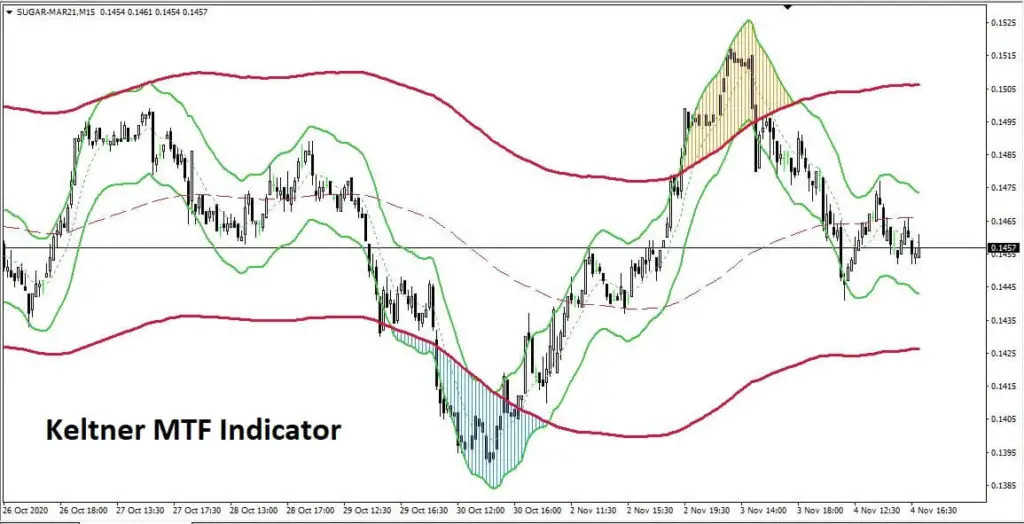
Keltner Mtf indicator is based on Moving Average of price data and Average True Range of the Moving average of price Data. It can be used as reversal trading system and trend following system.
Keltner x2 mtf tt indicator Overview

Moving Averages are very simple trend following indicator which helps traders to determine trend in very simple manner. If price is trading above of the moving average then trend is up and if price is trading below the moving average then trend is down. Slope of the Moving Average also helpful for trading in rite direction of market. Both of the above concepts are used in Keltner Indicator along with Average True range to determine oversold and overbought conditions.
Keltner x2 mtf tt indicator Explanation
Average True Range helps to determine to historical and current market volatility. Upper and lower bands in Keltner channel are based on Volatility of Moving Averages. If bands are wide then volatility is high and if bands are narrow it means volatility is low in the market.
Dual Keltner Bands are used in this indicator Instead of one, which give double confirmation for the reversal setups. Red bands are based on longer period moving average and green bands are based on short period moving average.

Most of time market moves within the Kelter bands and if market is touching the upper band it means market is overbought and if price is touching the lower band it means market is in oversold condition. If price is trading outside of both of then bands then it gives indication that price reversal is near. Traders should initiate the trade when price start trading within both of band again after overbought or oversold conditions.
Also Read : RoboForex Review – Get $30 Welcome Bonus
Keltner x2 mtf tt indicator : Buy conditions

- Down trend in market.
- Price gives breakout upside from both of the upper bands.
- Entry point is when price again start trading inside both of the bands.
Keltner x2 mtf tt indicator : Sell Conditions

- Up trend in market.
- Price gives breakdown from both of the Lower bands.
- Entry point is when price again start trading inside both of the bands.