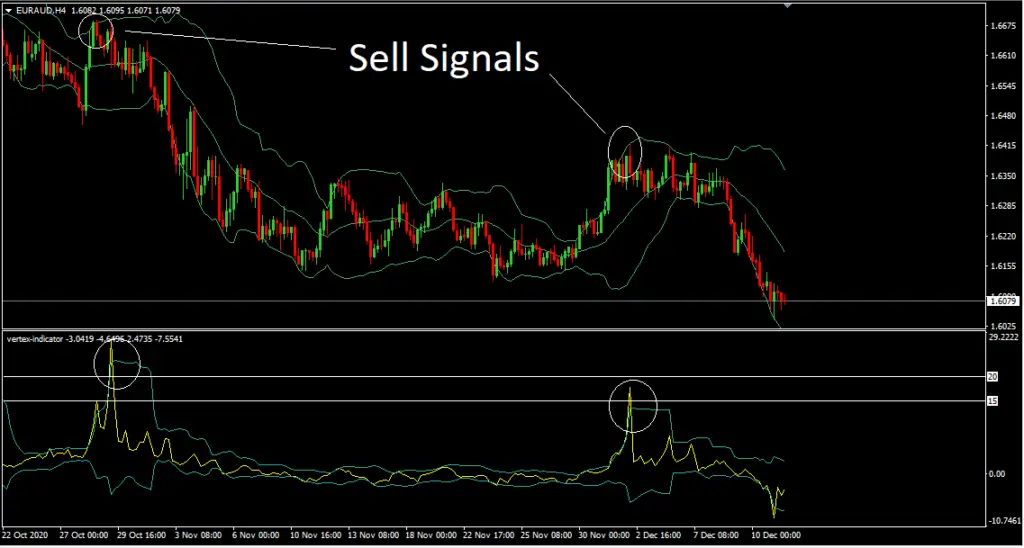
Vertex with Bollinger Bands is a Volatility based mean revision trading system that allows traders to catch the early trend reversal. This System consists of a Vertex indicator along with Bollinger bands on price and vertex Indicator. Let’s try to understand the working of this trading system.
Vertex With Bollinger Bands Overview
Vertex indicator is based on the Volatility of the price. Often Price is more volatile when trend reversal is near. Vertex indicator gives breakout from the upper band when a new downtrend is about to start and it gives breakout from the lower band when a new uptrend is about to start.

15 & 20 levels are added as a filter, which can protect traders from trading the wrong signals. Traders should look for buy or sell signals only when those are generated near the important level in the vertex indicator.
Vertex With Bollinger Bands Explanation
Bollinger bands indicator is also a volatility-based indicator which is based on a standard deviation of the moving average of the price data. After an uptrend move, the price fails to reach the outer Band as the uptrend becomes weaker and Upper Band starts providing resistance to the price.

Similar way after a downtrend move, the price fails to reach the lower Band as the downtrend becomes weaker and the lower Band starts working as a support area. While trading trend reversal, traders should look for sell trades near the upper band and buy trades near the lower band.
When the Vertex indicator gives a breakout from the upper band and the price takes resistance on the upper Bollinger band, a trader should look for short trades in the market.
Continue Reading: How to Open Exness MT4 & MT5 Forex Trading Accounts?
And when vertex indicator gives breakout from the lower band and price take support from the lower Bollinger band, traders should look for long trades in the market. Moving Average of Bollinger band can be used as Trail stop loss.
Vertex With Bollinger Buy Signals

- Breakdown On lower band on Vertex Indicator near the important level.
- Price Take Support on lower Bollinger band.
- Stop-loss should be placed below the Lower Band.
Vertex With Bollinger Sell Signals

- Breakout On upper band on Vertex Indicator near the important level.
- Price Take resistance on the upper Bollinger band.
- Stop-loss should be placed above the upper Band.