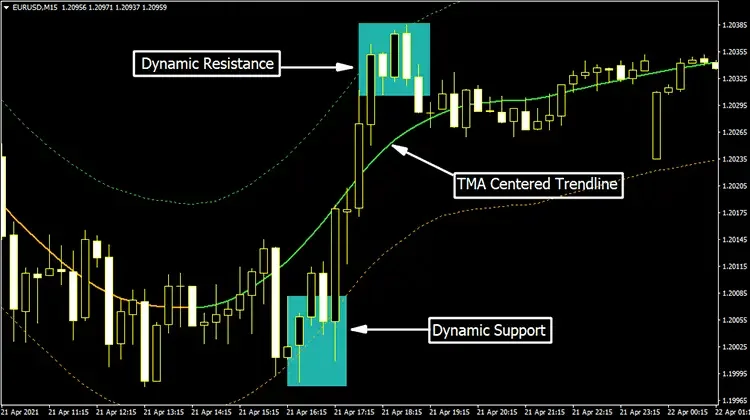
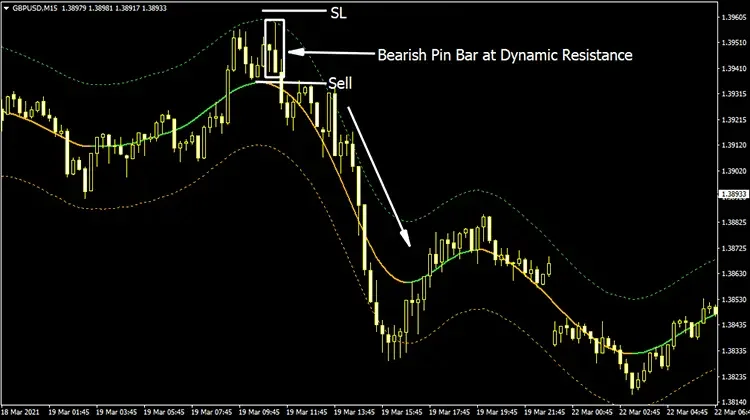
The TMA Centered Bands Multi Time Frame is a trend-following price channel. This indicator shows the dynamic support and resistance, defines the trend conditions, and highlights potential areas to enter the market.
Generally, Triangular Moving Average (TMA) is applied to signify the changes in the directions of the market trends. However, in this new edition, the indicator includes two extra bands which work as dynamic support and resistance. The higher and lower bands of the indicator create a price channel and the TMA at the center of the channel shows the direction of the market trend.
TMA Centered Bands Multi Time Frame represents a stand-alone trend trading technique that is admired by both beginners and experienced traders. It supports multi-timeframe trend analysis and can be applied for trading all types of financial instruments including forex, stocks, cryptocurrencies, and more.
TMA Centered Bands Multi Time Frame Overview
TMA Centered Bands Multi Time Frame represents a very simple demonstration of trend conditions so that everybody can follow it. This indicator doesn’t produce direct buy sell signals. But it shows strong support and resistance zones of the price and gives an idea about the overall condition of the market trends.

According to our research, TMA Centered Bands Multi Timeframe works best as a day trading indicator. Moreover, you can apply it on multi-timeframes of MT4 platforms for having a greater confirmation of the market trends and potential price levels.
TMA Centered Bands Multi Time Frame Explanation
The lower TMA-centered band represents the dynamic market support. In a bullish market trend, we expect the price to reverse from this level to rejoin the current uptrend market. The price creates a higher-high at the TMA support represents an ideal setup for going long.

Contrarily, when the price hits the upper band it should treat the level as a dynamic resistance. In an extreme bullish move, the resistance can be broken. However, most of the time the price rebounds from the upper TMA band and starts to move north.
The direction of the centered TMA line shows you the possible direction of the market trend. It also signals the trend strength level. For example, the price holding its position above the TMA level hints at a strong bullish trend of the market.
Also Read: Best Forex Brokers in South Africa
TMA Centered Bands: Buy Conditions

- The price rejects to move below the TMA support line
- The price rebounds from the dynamic support and the TMA trendline heads upward direction
- Place stop-loss limit below the lower TMA band
- Hold your buy order until the trade achieves a 2R profit
TMA Centered Bands: Sell Conditions

- The price fails to move above the TMA resistance level
- The price swings downwards from the dynamic support with the TMA trendline heading south
- Place stop-loss limit above the higher TMA band
- Exit the trade once it achieves a 2R profit