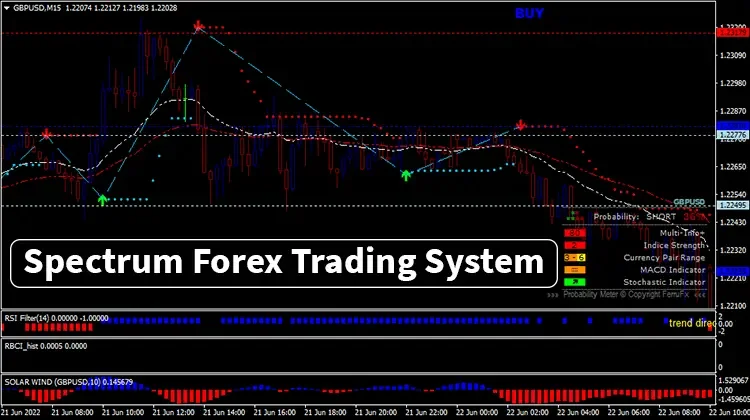
The Spectrum Forex Trading System represents a trend-following day trading strategy for MT4. It combines dynamic trendlines and smoothed moving averages with multiple trend oscillators for determining potential buy-sell signals.
Technically, Spectrum Forex Trading System works better on shorter timeframes and perfectly suits scalping or day trading. While backtesting, we’ve found the indicator works best in between 5-minute to 30-minute charts.
Spectrum Forex Trading System Overview

The Spectrum Forex Trading System comprises moving average crossovers and Buy Sell Magic, ensuring the signals are perfectly aligned within the current market trend. Moreover, it applies a triple trend filtering system so traders can precisely assess the current trend condition.
Spectrum Forex Trading System Explanation

The 11 MA(red) and the 21 MA(white) generate crossover trend signals. These moving averages are technically smoothed and work as dynamic support/resistance levels.
After getting a trend confirmation, use the Buy Sell Magic arrow signal to make your primary trading decision. Besides, the Pivot Points Multi-Timeframes indicator plots horizontal lines showing key support resistance levels of the price.
Before confirming an order, verify the signal using the RSI Filter, RBCI Hist, and Solar Wind trend oscillators. These indicators plot blue and red bars, providing buy-sell confirmations and useful trend information. Additionally, you can decide on a trade exit whenever the Solar Wind signals an opposite trend to your entry.
Spectrum Forex Trading System: Buy Conditions

- The 11 MA moves above the 21 MA
- Buy-Sell Magic plots a green arrow
- The price breaks above the immediate pivot resistance
- RSI Filter bars turn blue
- RBCI hist and Solar Wind plots blue bars, showing positive values
Also Read: Exness Review – Is it The Best Forex Broker?
Spectrum Forex Trading System: Sell Conditions

- The 11 MA drops below the 21 MA
- Buy-Sell Magic shows a red arrow
- The price moves below the immediate pivot support
- RSI Filter bars transform into a red color
- RBCI hist and Solar Wind value turns negative and plot red bars