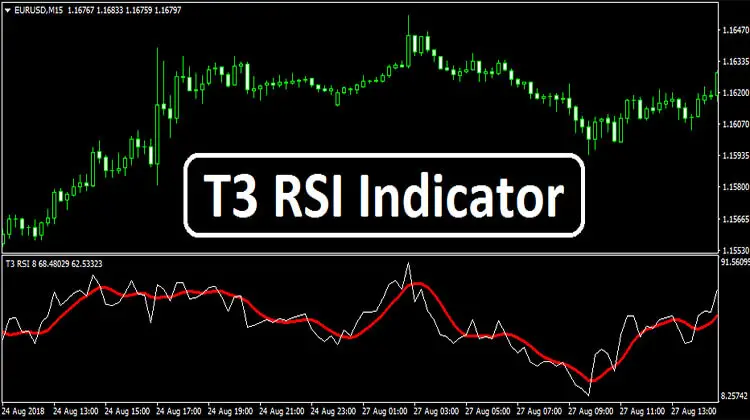
T3 RSI Indicator is an amazing invention for modern Forex day traders because it produces highly effective Forex trend signals by the crossover of T3 and RSI. It demonstrates the market trend status in a simple manner so that traders from all levels can be benefited by applying it to their daily trading charts.
T3 RSI Indicator is usable to trade all kinds of Forex currency pairs and it also fits great with all sorts of timeframe charts. Therefore, from scalpers to intraday or even long-term traders, everybody can be benefited by using this awesome Forex indicator.
T3 RSI Indicator Overview
After you install the T3 RSI Indicator at your Forex MT4 platform, your trading chart will appear like the following image:

This indicator plots crossover signals with the collaboration between T3 and RSI. RSI (white) moves above the T3 (red) signaling the bullish crossover which confirms the bullish trend and the buy signal as well.
On the other hand, RSI moves below the T3 indicating the bearish crossover that certifies the current market momentum as the bearish trend and is also considered as the sell signal. T3 RSI indicator suggests traders buy from the bottom and sell from the top while trading in the market.
Similar System: RSI Extreme System
T3 RSI Indicator: Buy Parameters

- RSI moves above the T3 indicator representing the bullish crossover
- The price bar forms a bullish candle at the bottom area of the chart
- Buy triggers when the bullish bar’s high is broken
- Set stop loss below the current swing low of the market
- Exit long/take profit whenever the T3 RSI indicator plots the bearish crossover
T3 RSI Indicator: Sell Parameters

- RSI moves below the T3 indicator representing the bearish crossover
- The price bar forms a bearish candle at the top area of the chart
- Sell triggers when the bearish bar’s low is broken
- Set stop loss above the current swing high of the market
- Exit short/take profit whenever the T3 RSI indicator plots the bullish crossover