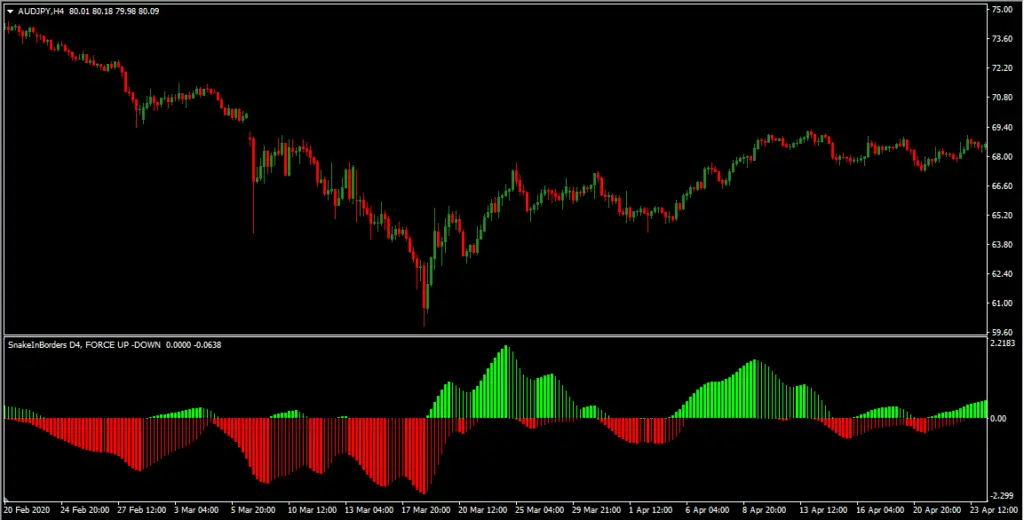
Snake Force Indicator is a trend indicator which is designed to compare the force of different price action structures and guide trader about the right direction of the market.
Traders generally lose big money by trading against the trend. This indicator Is designed to trade in the direction of the trend and it allows the trader to avoid confusion in trend determination. Let’s try to understand the working of the Indicator.
Snake Force Indicator Overview
Snake force indicator plot green and red histogram at the same time, based on strength of price action. If the price is in a strong uptrend then this indicator will plot a thick green histogram above the zero levels.

During the uptrend when the price gives a pullback, this indicator will plot Red histogram which would be less thick than the green histogram. If the price is in a strong downtrend then the indicator will plot the thick red histogram below the zero levels.
During the downtrend when the price gives a pullback then the indicator plots the green histogram which would be smaller than the red histogram. So by comparing the heights of bull and bear histogram traders can get an idea about the force of the trend.
Snake Force Indicator Explanation
Traders can analyze the force of the trend in two different ways. In an uptrend, traders can compare the peaks of the swings with the height of the green histogram and the trough of the pullback with the height of the red histogram.

In a downtrend, traders can compare the lows of the swings with the height of the red histogram and the highs of the pullback with the height of the green histogram. Traders should look for divergence and hidden divergence indication in price action and snake force indicator.
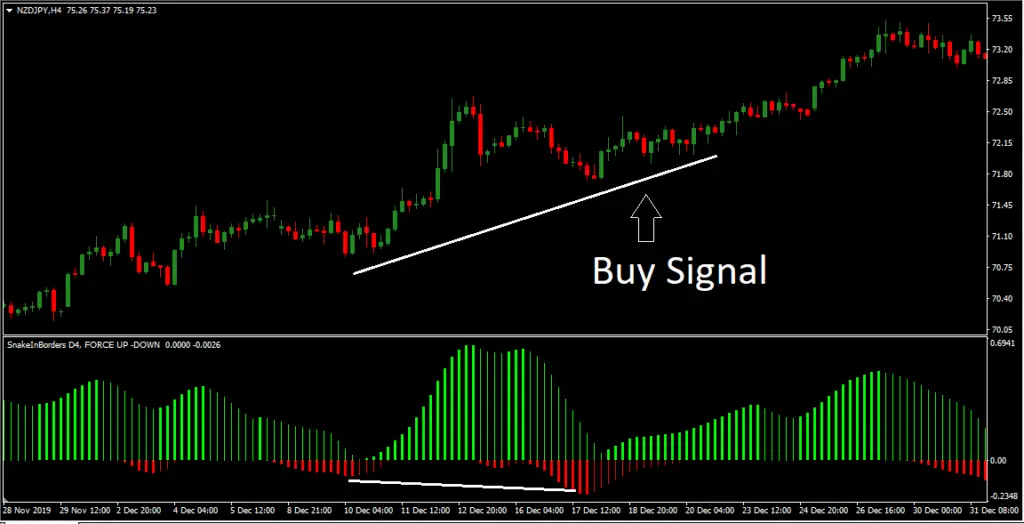
Snake Force: Buy conditions

- Price forming higher high and higher low structure.
- The height of the Green histogram is more than the height of Red histogram.
- During pullback in uptrend, Price form higher low and Red bars of histogram forms lower low.
- Traders can hold the trade till the time price form higher high and higher low structure.
Check Out: Trend Trading Indicator
Snake Force: Sell conditions

- Price forming lower high and lower low structure.
- The height of the Red histogram is more than the height of the green histogram.
- During pullback in Downtrend, Price form lower high and green bars of histogram form higher high.
- Traders can hold the trade till the time price form lower high and lower low structure.