
Scalping is indeed a very attractive trading approach, especially for newbie traders. It is like surfing in the big wave of money markets which involves a lot of excitement and challenges as well. Scalping is definitely profitable only when have a proven trading strategy and you are disciplined enough to follow your trading rules in a strict manner.
In this article, we’ll discuss a scalping strategy which is combined with Parabolic SAR and Fibonacci. Parabolic SAR helps to define the market trend and generates trends following trade signals. On the other hand, Fibonacci plots the price retracement levels so that traders can determine a better and safer place to enter the market.
Moreover, this scalping technique can also be used for intraday trading purposes. Thus, besides short timeframes like M1 to M15 or M30, this strategy also fits with H1 & H4 charts.
Scalping with Parabolic SAR and Fibonacci Overview
You do not need to install any extra indicator in your trading system for this strategy setup. This is because Parabolic SAR and Fibonacci are already installed at your MT4 trading platform. You only need to configure them as required and once you are done, your chart will appear like the following image:

The Indicators & Setup

Parabolic SAR1 (Step: 0.02 & Maximum: 0.2): Used to define short-term trends of the market. Price holding above its level means the trend is bullish and an opposite scenario represents the bearish trend of the market.
Parabolic SAR2 (Step: 0.005 & Maximum: 0.05): This one works as a filter of the trend signals plotted by the Parabolic SAR1. You’ll only enter long when P.SAR1 moves above the P.SAR2 level. Conversely, P.SAR2 moves above the P.SAR1 level, which means it is time to go for short entries.
Fibonacci: This indicator is used as a scale to measure the retracement level of the market compared to its recent high-low range. The rule is, that you’ll only enter a trade when the price hits its 50% retracement level of the current range.
Learn to Trade on: Head & Shoulder Pattern
Scalping with Parabolic SAR and Fibonacci Buy Parameters
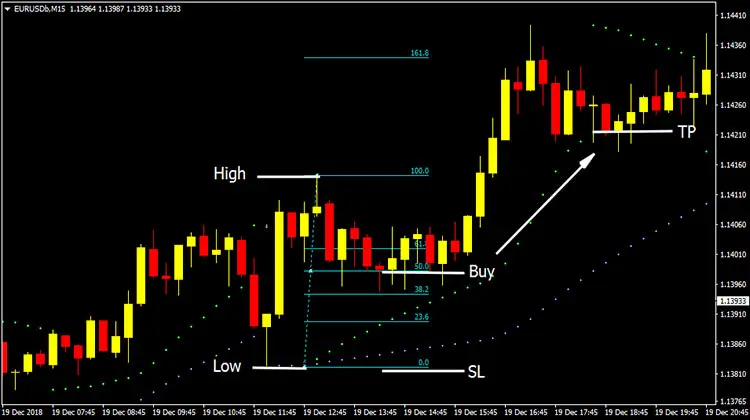
- Parabolic SAR1 moves above Parabolic SAR2
- Price retraces up to 50% level of its current range determined by the Fibonacci
- Buy triggers when the above conditions are met
- Set stop loss below the Parabolic SAR2 level
- Take profit whenever the price hits the Parabolic SAR1
Scalping with Parabolic SAR and Fibonacci Sell Parameters

- Parabolic SAR2 moves above Parabolic SAR1
- Price retraces up to 50% level of its current range determined by the Fibonacci
- Sell triggers when the above conditions are met
- Set stop loss above the Parabolic SAR2 level
- Take profit whenever the price hits the Parabolic SAR1


Hello sir
great indicators you have here…….Please upload the amazing system called fx venom pro
Thanks:-)
Take profit when price hits parabolic 2 NOT 1 sir.
Please revise
Hello Arun
Thank you so much for sharing this info with us. However, would you please clarify which one is SAR 1 and which one is the SAR2. According to the second figure, SAR2 is the green one, but in the third figure you named it SAR1. So please clarify.