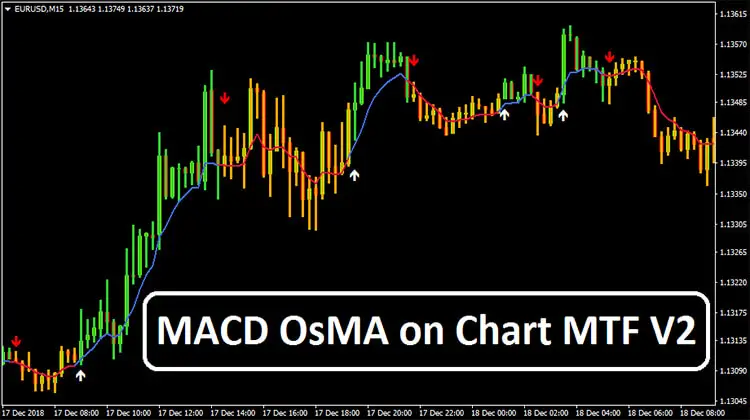
MACD OsMA on Chart MTF V2 is one of the simplest trend-following forex trading indicators you may have ever experienced. It defines the market trend and signals for trade entries by using clear-up/downward arrows. The application of this indicator is so simple that even a newbie trader can use it to carry out their trend-based trading activities.
MACD OsMA on Chart MTF V2 can be applied to trade all kinds of forex currency pairs around the financial markets. Moreover, this indicator works on all sorts of timeframe charts within the MetaTrader 4 trading platform.
MACD OsMA on Chart MTF V2 Overview
Once you’re done with the installation of the indicator at the MT4 terminal, your trading chart will appear like the following image:

MACD OsMA on Chart MTF V2 Anatomy
MACD OsMA on Chart MTF V2 forms a slope indicator with the combination of MACD and OsMA. It works almost like a Moving Average. It automatically turns blue to signal the bullish trend of the market whenever a price bar successfully closes above its level.

Contrarily, it turns red when the price moves below the indicator level, signaling the market’s bearish trend. A white upward arrow below the price bar is considered a signal for the buy entry, and a red downward arrow above the price bar signals the short entry. Opposite signals against an active trade can be treated as an exit signal.
MACD OsMA on Chart MTF V2: Buy Conditions

- The Indicator turns blue
- A white upward arrow appears below the price bar
- Buy triggers when the above conditions are met
- Set stop loss below the current indicator level
- Exit long/take profit whenever a red downward arrow appears above the price bar
MACD OsMA on Chart MTF V2: Sell Conditions

- The Indicator turns red
- A red downward arrow appears above the price bar
- Sell triggers when the above conditions are met
- Set stop loss above the current indicator level
- Exit short/take profit whenever a white upward arrow appears below the price bar
hi
how do you manage when the trade fails? or can u just take everything signal and the winner will outweigh the lossession
also so you enter when the price breaks the high of the arrow candle.
Hi Arun,
Is there a MT5 equivalent version? Tq!