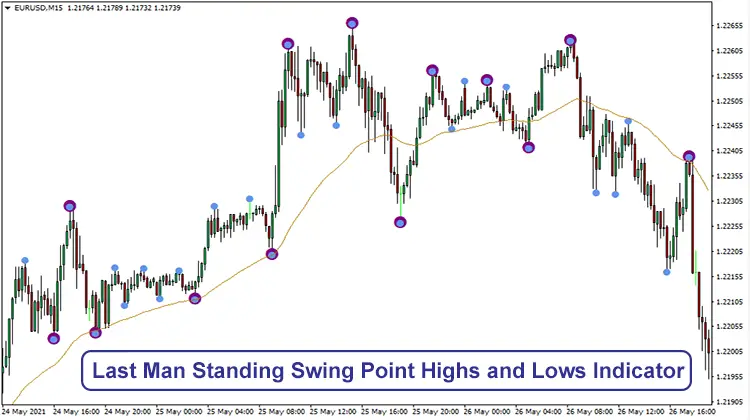
The Last Man Standing Swing Point Highs and Lows Indicator is a trend-based trading tool for MT4 platforms. Besides the trend signals, it also shows dynamic S/R levels and major/minor swinging areas of the price.
This indicator spots both swing trading and trend-following trading opportunities. Besides, it suits all types of forex and stock assets available for online trading. In terms of flexibility and functionality, this indicator is a good fit for beginners.
Last Man Standing Swing Point Highs and Lows Indicator Overview
The Last Man Standing Swing Point Highs and Lows Indicator uses three different tools for determining the trend and trade levels of the assets. Its Exponential Moving Average (EMA) works on identifying the trend status and key support/resistance levels of the price.

Moreover, its fraction tool shows the major and minor swinging areas of the market. The minor swinging signals are good for day tradings. On the other hand, the minor swinging signals are ideal for both scalping and intraday entries.
Last Man Standing Swing Point Highs and Lows Indicator Explained
The curved line across the middle of the chart represents a 55-day Exponential Moving Average (EMA). An EMA stresses more on recent price movements and provides greater accuracy in determining the short-term/intraday market trends. The 55-EMA spots the changes in market trends and highlights the dynamic support/resistance levels.

The small dots above and below the price indicates the minor swing areas of the price. On the other hand, the bold dots signal the major price swing levels. Whenever the price intersects the 55-EMA level, use the dot signals for finding the best price swing areas in favor of the current market trend. Once you get the confirmation about the trend and level, activate your order within the trend direction.
Also Read: Exness Review – Is it a Best Forex Broker?
Last Man Standing Swing Point Highs and Lows Indicator: Buy Conditions

- The price moves above the 55-EMA
- The swing signal dot appears below the price candle low
- SL below the EMA
- Take profit whenever the price breaks the EMA support
Last Man Standing Swing Point Highs and Lows Indicator: Sell Conditions

- The price drops below the 55-EMA level
- Swing signals dots are plotted above the candle’s high
- SL above the EMA level
- Take profit whenever the price moves above the EMA