I am back with another brilliant forex trading strategy-“Hedge Fund Forex Strategy”. It is a kind of forex trading strategy that hedge fund traders use. You might be surprised that hedge funds use such simple strategies. Yes, simple trend following strategy works as fine as sophisticated automated trading systems.
Majority of hedge funds use mechanical trading robots. Meaning that this same strategy is used in automated environment, no manual work has to be done by the traders. But for retail traders like you, doing some manual work pays off too.
However, you can run automated version of this strategy in your MT4 using some expert advisor coding. It is still fine with manual work otherwise.
Hedge Fund Forex Strategy Overview

Hedge Fund Fx Strategy
| Time Frame | Currency Pairs | Number of Indicators | Rating |
| M5, H1, H4, and Daily | Any | 5 | 9.8/10 |
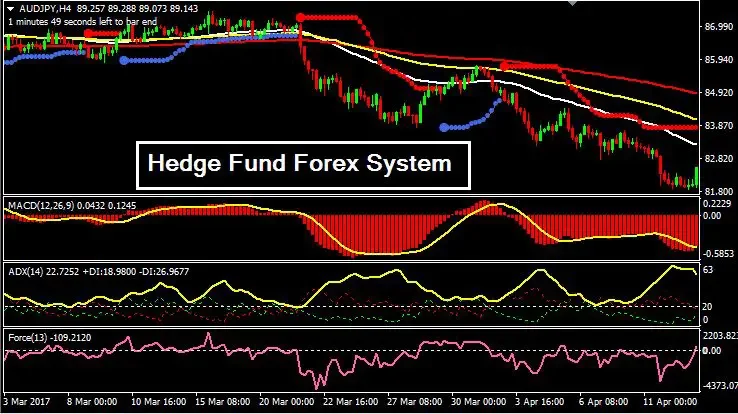
Hedge Fund Fx Strategy has 5 indicators altogether. All of them are classic indicators. I should always tell you that you should have a basic concept of market trend before using any trend following strategies. After you successfully install Hedge Fund Forex Strategy your chart should look like this:
I have listed the indicators used in Hedge Fund Forex System
Hedge Fund Forex Strategy Indicators Overview

| Main Chart | Indicator Window 1 | Indicator Window 2 | Indicator Window 3 |
| Moving averages | MACD | ADX | Force |
| BBands Stop | – | – | – |
- Moving Averages
There are three moving averages used here. White is a 50-period exponential moving average. Yellow is a 100-period exponential moving average. Red is a 200-period moving average. When white moving average is above the rest, it is a good bullish trend. Similarly when white moving average is below the rest, it indicates a good down trending market.
- Bbands Stop
Bbands Stop is the blue and red dots that you see on the chart. When the market is above this indicator, it indicates bullish market scenario and vice versa.
- MACD
MACD indicator here is a combination of an oscillator and histogram. Positive histogram suggests rising market scenario while the negative histo suggests downward trend.
- ADX
ADX has +ve (green) and –ve (red) signal line and a MACD (yellow) line. When +ve line is above –ve line it is an uptrend scenario and vice versa.
- Force
Force oscillator fluctuates in positive and negative space. You should look for long opportunities only when this oscillator is positive and you should short only when this indicator is negative.
Also Read: Exness Review
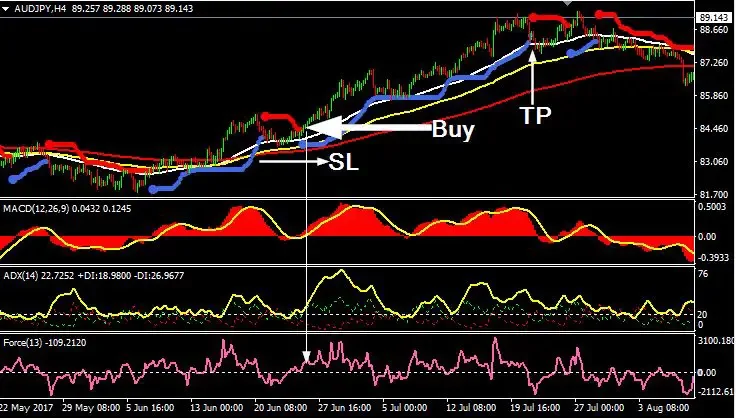
Hedge Fund Forex Strategy: Buy Parameters

- Trend of the market should be up.
- White moving average should be above rest of the moving averages.
- Bbands stop indicator should be below the market.
- MACD histogram should be in positive territory.
- ADX should be rising.
- Force indicator should be in positive territory.
- Buy at the market rate when all of the above parameters are met.
- Put your stop loss just below the recent support level.
- Book your profit when Bbands stop indicator appears above the market.
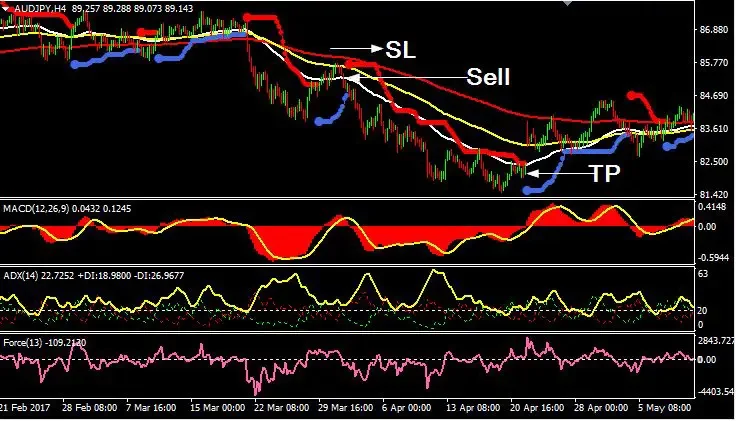
Hedge Fund Forex Strategy : Sell Parameters

- Trend of the market should be down.
- White moving average should be below rest of the moving averages.
- Bbands stop indicator should be above the market.
- MACD histogram should be in negative territory.
- ADX should be rising.
- Force indicator should be in negative territory.
- Sell at the market rate when all of the above parameters are met.
- Put your stop loss just above the recent resistance level.
- Book your profit when Bbands stop indicator appears below the market.

Dear Mr. Arun Lama,
Thank you very much for this trading system.
It’s a powerful one if used on the higher time frame of 4H and Daily.
Thank you!