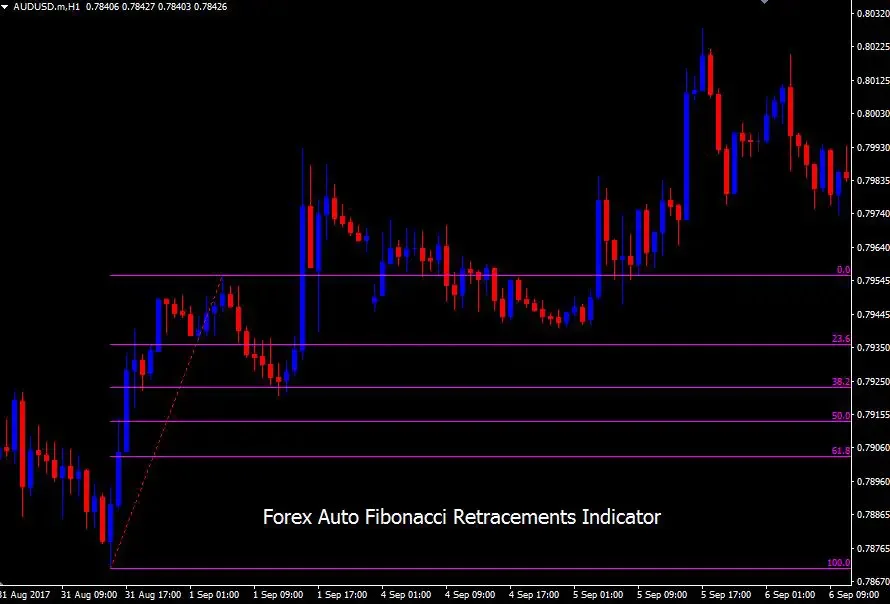
The easiest and simplest indicator to spot a perfect reversal point…
Auto Fibonacci Retracements Identifies High Probability Swing Levels of The Trend Momentums. It Makes You Relax While Trading Because It Spots The Place in Advance Where You Should Look For The Expected Reversal.
This indicator works at any currency pair and any time frame as long as price naturally retraces and perfect for all genre (scalpers, intraday swing/long-term) of traders. The most important thing is, it is easily usable by newbie traders.

Mostly price doesn’t keep moving in a single direction all the time as sometimes it takes a break with a retracement or pullback then resumes moving towards the trend direction again. If you can’t catch the right retracement point then you’ll be able to get a better length of momentum with a greater probability of winning a good level of risk to reward ratio.
Let’s go a little deeper with the chart demonstration:

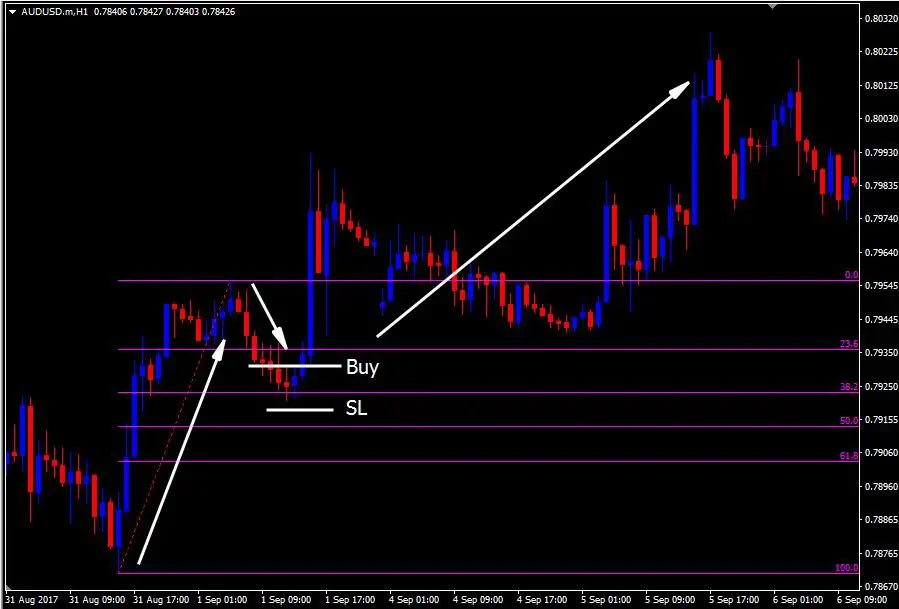
This is an AUDUSD hourly chart. Price was initially in an uptrend then it started to retrace back. You see the various levels of retracement lines showing the most possible swinging point of price from where it will restart moving upwards again. At a point, the price took support from the 38.2% retracement level which is our buy area. Stop loss will be set right below the swing level. As we can see price really jumped up from that level and went away to the north.
Do Not Miss: Forex RSI MA Trading Strategy
Auto Fibonacci Retracement considers the high and low of the current trend and automatically generates possible retrace levels for traders.
Let’s see some more examples:

At this GBPUSD hourly chart, price trending up initially and later retraced twice to the level of 23.6% and each time took support from the respective level. In both cases price went up and kept the bullish momentum alive.
Now, let’s look at a bearish trend retracement entry:

This is a EURUSD hourly chart. There was a massive selling force at the early stage of the chart and the retracement level was also huge. It retraced above 62.8% but letter returned back below of that area confirming that the initial bearish force is taking control of the momentum again.
Auto Fibonacci Retracement is a trend following Indicator. So, traders should be able to detect the trend correctly before applying this indicator.

Which system is really function?