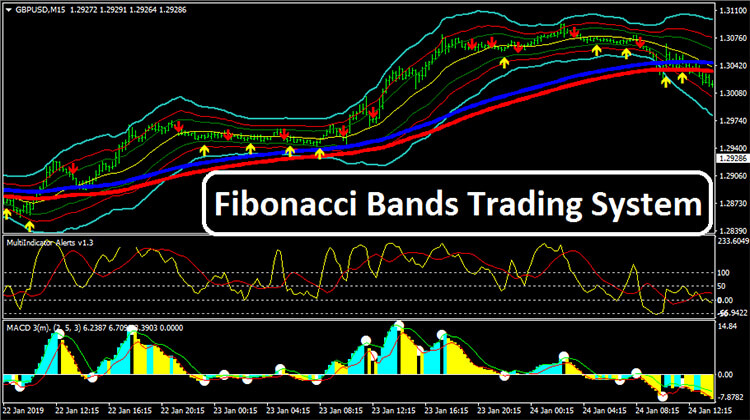
Fibonacci Bands Trading System uses a combination of multiple indicators and oscillators in order to develop a strategy that closely follows the market trend and generates the trade signals within the trend direction. This forex trading system also helps traders to define the stop loss and trade exit areas of each open trade position.
Fibonacci Bands Trading System is applicable to trade any kind of forex currency pair around the market. Moreover, this forex trading system fits great with all sorts of timeframe charts within the Metatrader 4 trading platforms.
Also Read: Radar Signal System
Fibonacci Bands Trading System Overview
After the installation of the Fibonacci Bands Trading System at the MT4 terminal, your trading chart will appear like the image below:

Fibonacci Bands Trading System Anatomy

- MultiInd: Plots the trade signals using up/downward arrows around the price bars. A green upward arrow below the price bar is considered as the buy signal and a red downward arrow above the price bar represents the sell entry signal.
- TLab Fibo Bands: Uses 3-set off multiple bands in order to scale the dynamic range of the market momentum. These bands help to determine the possible retrace or pullback level of the price before market re-joins the major trend.
- Buy Zone Fibo: Works as like as Moving Averages in order to filter the long entry signals generated by other indicators of the system. Price closing above its level is considered as the green light to go long.
- Sell Zone Fibo: Quite similar to Buy Zone Fibo but works on short entry purposes only. Price closing below its level in a downtrend market is considered as a confirmation to go for the short entry.
- MultiIndicator Alerts V1.3: It plots the crossover signals in order to define the market momentums. Its fast-MA(green) moves above the slow MA(red) represents the bullish crossover and an opposite scenario is considered as the bearish crossover signal of the market momentum.
- MACD: MACD works as the momentum filter signal generated by MultiIndicator Alerts V1.3. MACD remains positive means the current bullish momentum of the market is still intact. On the other hand, MACD with a negative value represents the validity of the current bearish momentum of the market.
Generally Accepted Use of Fibonacci Bands Trading System
Buy Conditions

- MultiInd plots an upward green arrow below the price bar
- Price is supported by the lower TLab Fibo Bands
- A bullish bar is formed right above the Buy Zone Fibo level
- MultiIndicator Alerts V1.3 plots the bullish crossover signal carrying a positive value
- MACD turns positive
- Buy triggers when the above conditions are met
- Set stop loss below the lower TLab Fibo bands
- Exit long/take profit whenever MultiInd plots a downward red arrow above the price bar
Sell Conditions

- MultiInd plots a downward red arrow above the price bar
- Price is resisted by the upper TLab Fibo Bands
- A bearish bar is formed right below the Sell Zone Fibo level
- MultiIndicator Alerts V1.3 plots the bearish crossover signal carrying a negative value
- MACD turns negative
- Sell triggers when the above conditions are met
- Set stop loss above the higher TLab Fibo bands
- Exit short/take profit whenever MultiInd plots an upward green arrow below the price bar