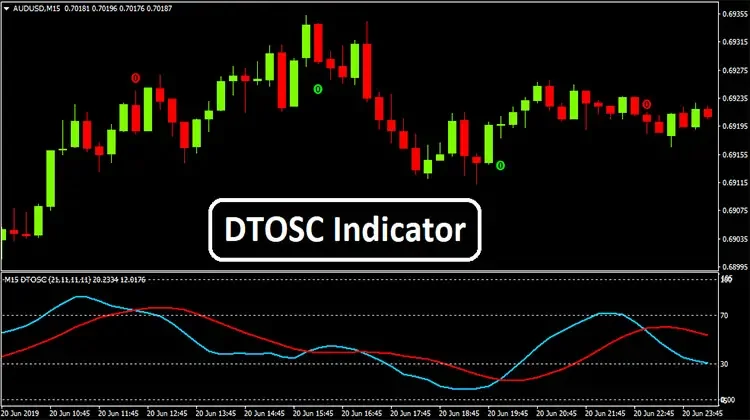
DTOSC Indicator determines market momentums based on its overbought/oversold signals using simple crossover techniques between RSI and Stochastics. It has been developed to assist swing traders especially scalpers who struggle to define the potential swing levels of the market.
DTOSC Indicator supports all kinds of forex currency pair charts including other financial assets like stocks, futures, and cryptos. However, as a scalping indicator, it suits best with M5 and M15 time frame charts.
DTOSC Indicator Overview
Once you’re done installing the Indicator at the MT4 terminal, you’ll find your chart like the image below:

DTOSC Indicator: Explanation

DTOSC Indicator uses Periodic RSI and Stoch-SD in order to produce the crossover signals. Periodic RSI moves above Stoch-SD means the bullish crossover signal. Contrarily, Stoch-SD moves above Periodic RSI represents the bearish crossover signal of the market trend. Its 70 to 100 value area is identified as the overbought level of the market. On the other hand, the area between 30 to 0 represents the oversold level of the market. Bullish crossover at the oversold level and bearish crossover at the overbought level is ideal signals to go for long and short entries respectively.
Also Read: How Profitable Is Moving Average in The Forex Market?
DTOSC: Buy Conditions

- The indicator value drops below its 30 level
- Periodic RSI moves above Stoch-SD at the same time
- Buy triggers when the above conditions are met
- Set stop loss below the recent low of the market
- Exit long/take profit whenever DTOSC Indicator plots bearish crossover near its overbought area
DTOSC: Sell Conditions

- The indicator value rises above its 70 level
- Periodic RSI moves below Stoch-SD at the same time
- Sell triggers when the above conditions are met
- Set stop above the recent high of the market
- Exit short/take profit whenever DTOSC Indicator plots bullish crossover near its oversold level