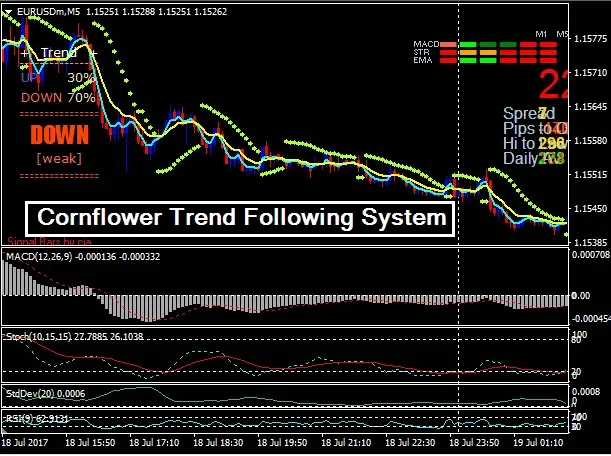
Cornflower Trend Following System is an amazing forex trading system with high level of signal accuracy. Cornflower Trend Following System is built for those who love to ride up and down swings of the market i.e. swing traders. Swing trading generally refers to the trading style in which you would be holding your positions for few days to few weeks. However in this case, it’s quite different. When you download this forex trading system you have different template options with different time frames. You have options to choose among 5 minute, H1, and Daily time frame. In this article I have used 5 minute time frame.
Cornflower Trend Following System Overview
| Time Frame | Instruments | Number of Indicators | Rating |
| M5, H1, and Daily | Any forex pairs | 6 | 9.8 |
After you successfully install Cornflower Trend Following System in your trading platform, your chart must look like this:

Altogether, almost a dozen of technical indicators have been used in Cornflower Trend Following System but you can make your job easier by focusing only on the major indicators of the system. Hence, I have covered only the major indicators of this system.
Cornflower Trend Following System Indicators Overview

| Main Chart | Window 1 | Window 2 | Window 3 | Window4 | |
| Moving Averages | MACD | Stochastic | Standard Dev | RSI | |
| Parabolic SAR | |||||
| Signal MACD |
A brief introduction to Cornflower Trend Following System indicators
- Moving Averages
Moving averages of 3 and 8 periods are used in this forex trading system. Aqua color moving average is a moving average of 3 bars while the golden moving average is a moving average calculated on the basis of 8 bars. Crossovers of these moving averages create the buy/sell signal.
- Parabolic SAR
Parabolic SAR is a very popular trend indicator; it is nothing more than combinations of dots which appear above/below the market rates. If Parabolic SAR is above the market price, it is generally an up trending market and vice versa.
- Signal MACD
This indicator shows you the overview of the several technical indicators. When this indicator indicates bullish market conditions, you should be going long and vice versa.
- MACD
You can see a MACD histogram which moves in positive and negative territory. When histogram is positive, look for buying opportunities and vice versa.
- Stochastic
Stochastic indicator here comprises of two oscillators which help you confirm trading signals based on its crossovers.
- Standard Deviation
Standard Deviation tells you about the volatility of the market. Usually it is good to see rising when the market is trending.
- RSI
RSI is a very popular indicator and almost everyone knows how to use it. You can use this indicator to confirm the strength of the trend.
You Must Read: The Best Forex Trading Strategy Ever
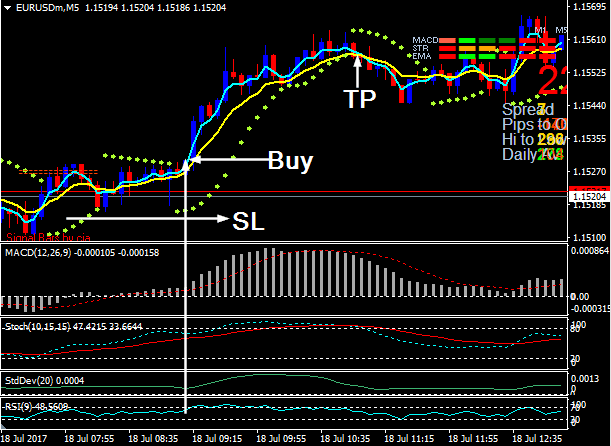
Cornflower Trend Following System: Buy Parameters

- Currency pair you are looking at should be trending upwards.
- Market should be bouncing from the recent swing low.
- Moving average should indicate bullish crossover.
- Parabolic SAR should appear below the market price.
- Signal MACD indicator should indicate bullish signal.
- MACD histogram should be positive.
- Stochastic should be up trending.
- Standard deviation should be rising.
- RSI should be rising.
- Place your long position as soon as above conditions are met.
- Place your stop loss just below the recent swing low.
- Take your profit when the Parabolic SAR indicator appears above the market.
Cornflower Trend Following System: Sell Parameters

- Currency pair you are looking at should be trending downwards.
- Market should be falling from the recent swing high.
- Moving average should indicate bearish crossover.
- Parabolic SAR should appear above the market price.
- Signal MACD indicator should indicate bearish signal.
- MACD histogram should be negative.
- Stochastic should be down trending.
- Standard deviation should be falling.
- RSI should be falling.
- Place your short position as soon as above conditions are met.
- Put your stop loss just above the recent resistance.
