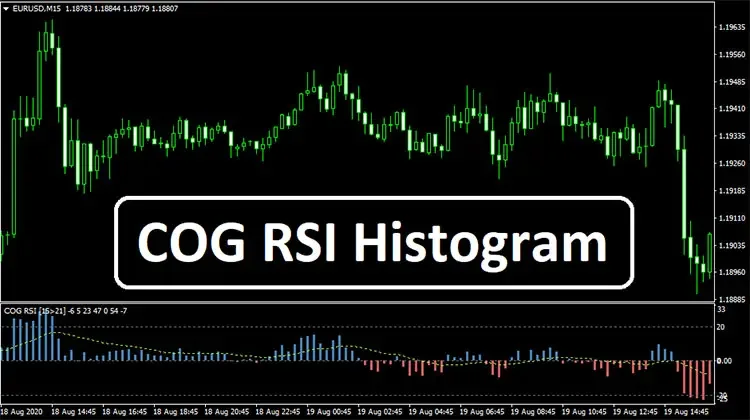
COG RSI Histogram is a forex swing trading indicator. It identifies possible swing levels from the pullback areas of a trend or ranging market. Besides determining the overbought and oversold areas it can also define the market trends at the same time. Therefore it leaves traders an opportunity to do swing tradings within the market trends.
This indicator can be applied to trade all kinds of forex currency pairs available in the market. Moreover, this RSI fusion suits all sorts of timeframe charts within your forex MT4 trading platform.
COG RSI Histogram Overview
Download the indicator and install it on your MT4 terminal. Once you’re done, find your chart like the image below:

Also Read: RoboForex $30 Welcome Bonus
COG RSI Histogram Explanation
COG RSI Histogram is a composition of COG RSI and STD Bars. Both of these tools work on determining the overbought and oversold condition of the market. COG RSI & STD Bar’s value at -20 means the market is in an oversold condition.
The value turns near 20 represents the overbought condition of the market. The indicator value roams close to its zero level means the market is in a neutral mode.

The COG RSI moves above the zero levels represents the bullish trend of the market. On the other hand, COG RSI carrying negative value signals for the bearish market trend.
COG RSI Histogram: Buy Condition

- COG RSI value drops up to -20 level and bounces upwards
- STD Bars turn blue and positive in value
- Buy Triggers after the above conditions are done
- Set stop loss below the current low of the market
- Exit long/take profit whenever The STD Bars value turn negative
Check Out: Deals and Discount
COG RSI Histogram: Sell Condition

- COG RSI value rises up to 20 levels and bounces downwards
- STD Bars turn red and negative in value
- Sell Triggers after the above conditions are done
- Set stop loss above the current high of the market
- Exit short/take profit whenever The STD Bars value turn positive