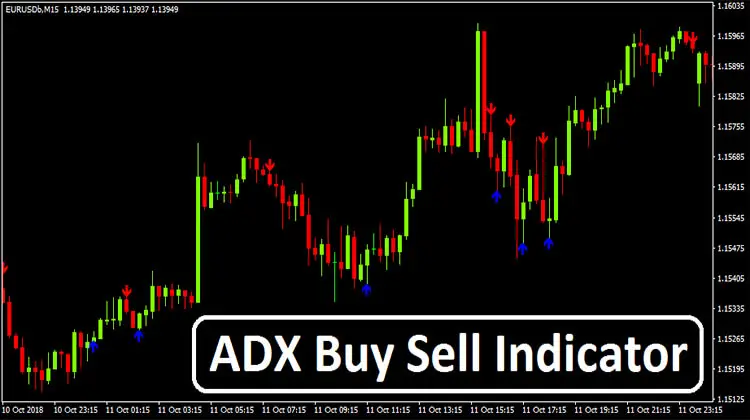
ADX Buy Sell Indicator is a trend following forex trading indicator that generates trade signals based on the Average Directional Index (ADX) – a very common name among the top-rated index-based indicators. This indicator offers great simplicity in demonstrating the trade signals so that even a newbie trader can be benefited by applying it for real trading purposes.
ADX Buy Sell Indicator can be applied to trade all kinds of forex currency pair charts available at the market. It has been designed for scalping purposes thus works better at lower timeframe charts like M1, M5 & M15.
ADX Buy Sell Indicator Overview
Once you’re done with the installation of the Indicator at your MT4 platform, your trading chart will appear like the following image:

Interesting Read: How Profitable is Moving Average in Forex Market
ADX Buy Sell Indicator Anatomy

This Indicator analyzes the ADX based on the market data of the selected period and demonstrates the trade signals based on its analysis. The trade signals are plotted as up/down arrows around the price bars. A blue upward arrow below the price bar represents the buy signal and a red downward arrow above the price bar is considered as the sell signal. An opposite signal compared to the trade entry can be used as an exit signal. As a short-term trading indicator, this Indicator produces frequent trading signals. Therefore, you may add other trend-following indicators like Moving Averages or Oscillators in order to filter the trade signals.
ADX Buy Sell Indicator: Buy Parameters

- The Indicator plots a blue upward arrow below a bullish bar
- The high of the signaling bar is broken by the following price candles
- Buy triggers when the above conditions are met
- Set stop loss below the respective bullish bar’s low
- Exit long/take profit whenever a red downward arrow is plotted above the price bars
ADX Buy Sell Indicator: Sell Parameters

- The Indicator plots a red upward arrow above a bearish bar
- The low of the signaling bar is broken by the following price candles
- Sell triggers when the above conditions are met
- Set stop loss above the respective bearish bar’s high
- Exit short/take profit whenever a blue upward arrow is plotted below the price bars
Very nice research done on this indicator. Are you aware if the indicator repaints? I don’t have a problem with it if it does, but it would be nice to know in regards to backtesting… 🙂
I am not quite sure on this regard. 🙂
Nice indicator, but the arrows seem to appear 2 bars later. Is this how its supposed to work?
It may be due to the lagging nature!
Very interesting